
This is a brief summary of my last paper: Sevil-Aguareles, J., Pisani, L., Chiarini, V., Santagata, T., & De Waele, J. (2025). Gypsum cave notches and their palaeoenvironmental significance: A combined morphometric study using terrestrial laser scanning, traditional cave mapping, and geomorphological observations. Geomorphology, 471, 109576. Open Access. https://doi.org/10.1016/j.geomorph.2024.109576
Gypsum caves, forming at a significantly faster rate than their limestone counterparts, offer valuable insights into short-term environmental changes occurring over millennia. However, reconstructing past environmental conditions requires understanding the cave’s history, particularly the direction of the ancient water flow that shaped it – its paleohydrology.
Determining the direction of water circulation in a fossil (inactive) cave passage, whether it functioned as a spring or a sink, typically relies on several indicators. These include the overall altitudinal profile, flow marks on cave surfaces like scallops, and sedimentological features such as the imbrication of fluvial clasts. Nevertheless, these markers can be absent due to erosion, condensation-corrosion, or burial by later sediments or speleothems. This is the situation in the Re Tiberio Cave system, located within the Vena del Gesso Romagnola Regional Park (Emilia Romagna, Italy). This multi-level cave network, developed within the Messinian gypsum units of the Monte Tondo area, extends for over 7 km across five main sub-horizontal levels and additional minor sectors, representing the most extensive epigenetic karst system in the region. The main level entrance is situated at 180 m a.s.l., 83 m above the Senio Stream, and its initial 80 m are open for tourist visits because its archaeological and historical interest (Figure 1).
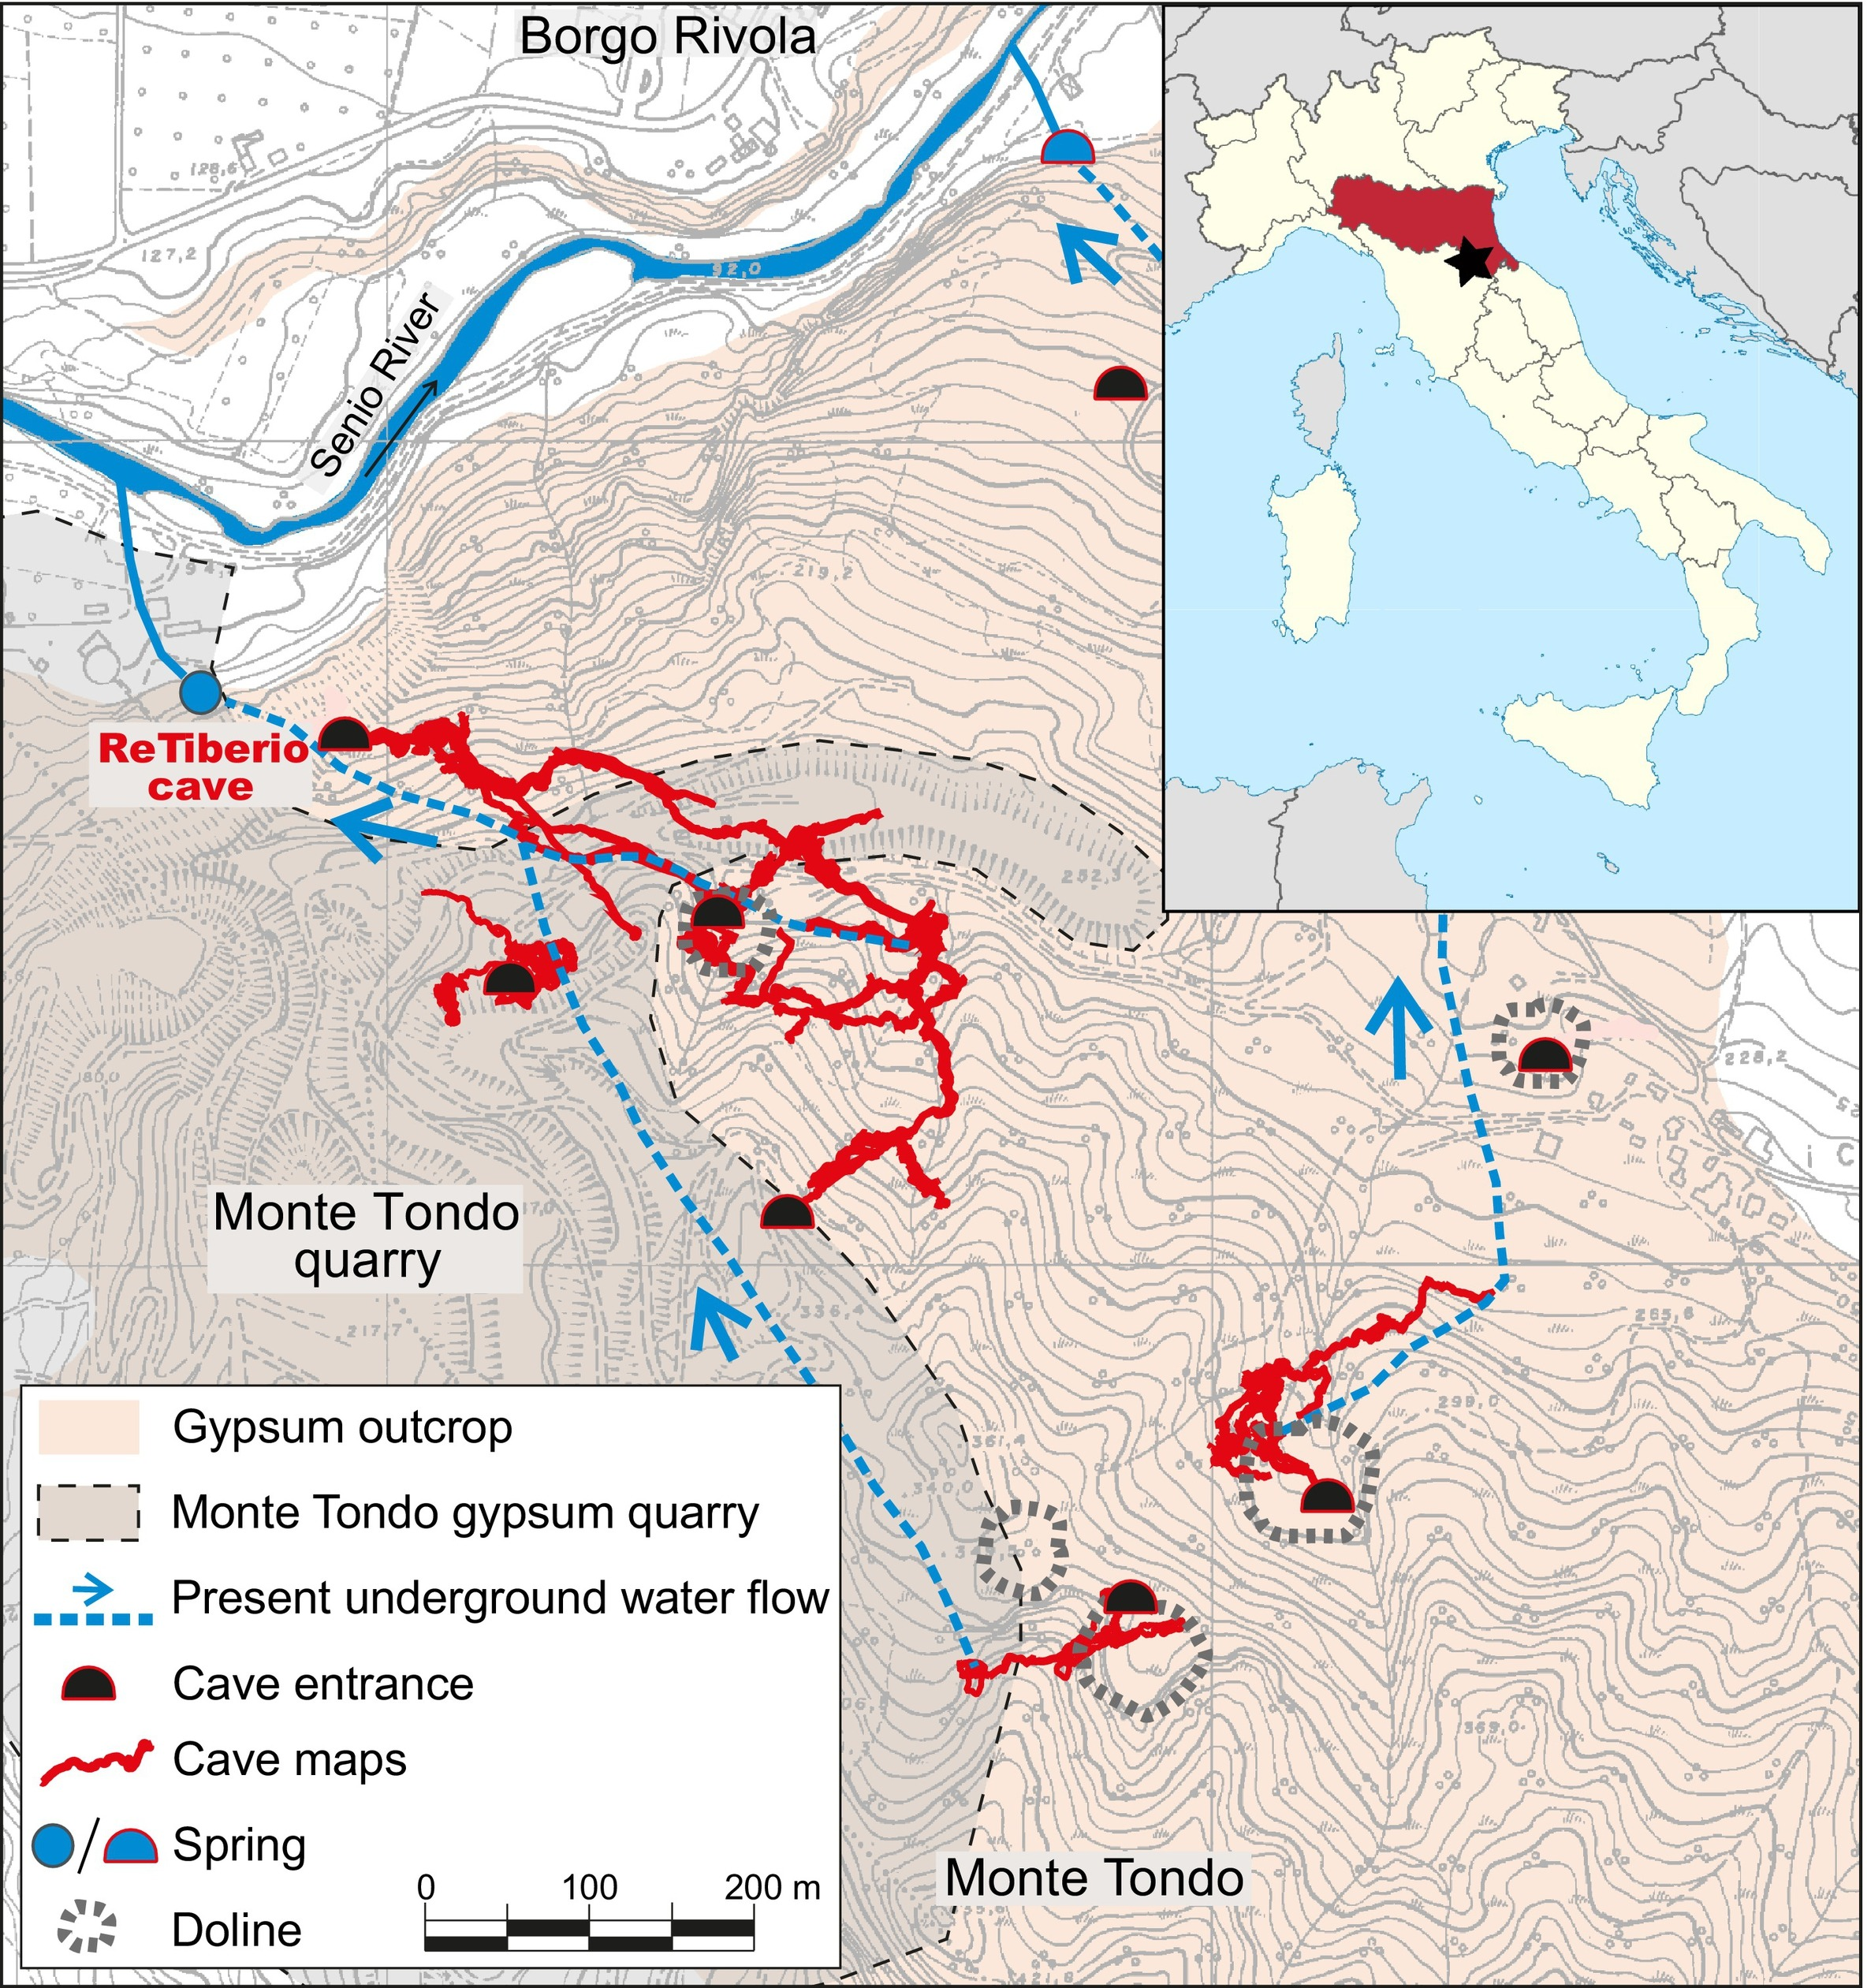
Previous studies of this cave system have generally assumed that the natural entrance of the Re Tiberio Cave’s main gallery acted as a spring during its formation. However, aside from the passage’s overall low gradient, which is consistent with a final section of an active cave branch near its outlet, no other clear and evident signs of flow direction have definitively supported this interpretation.
To resolve this ambiguity, our study integrated traditional cave surveying techniques with laser scanning to analyze the cave’s wall morphologies and sedimentary features. Our methodology comprised:
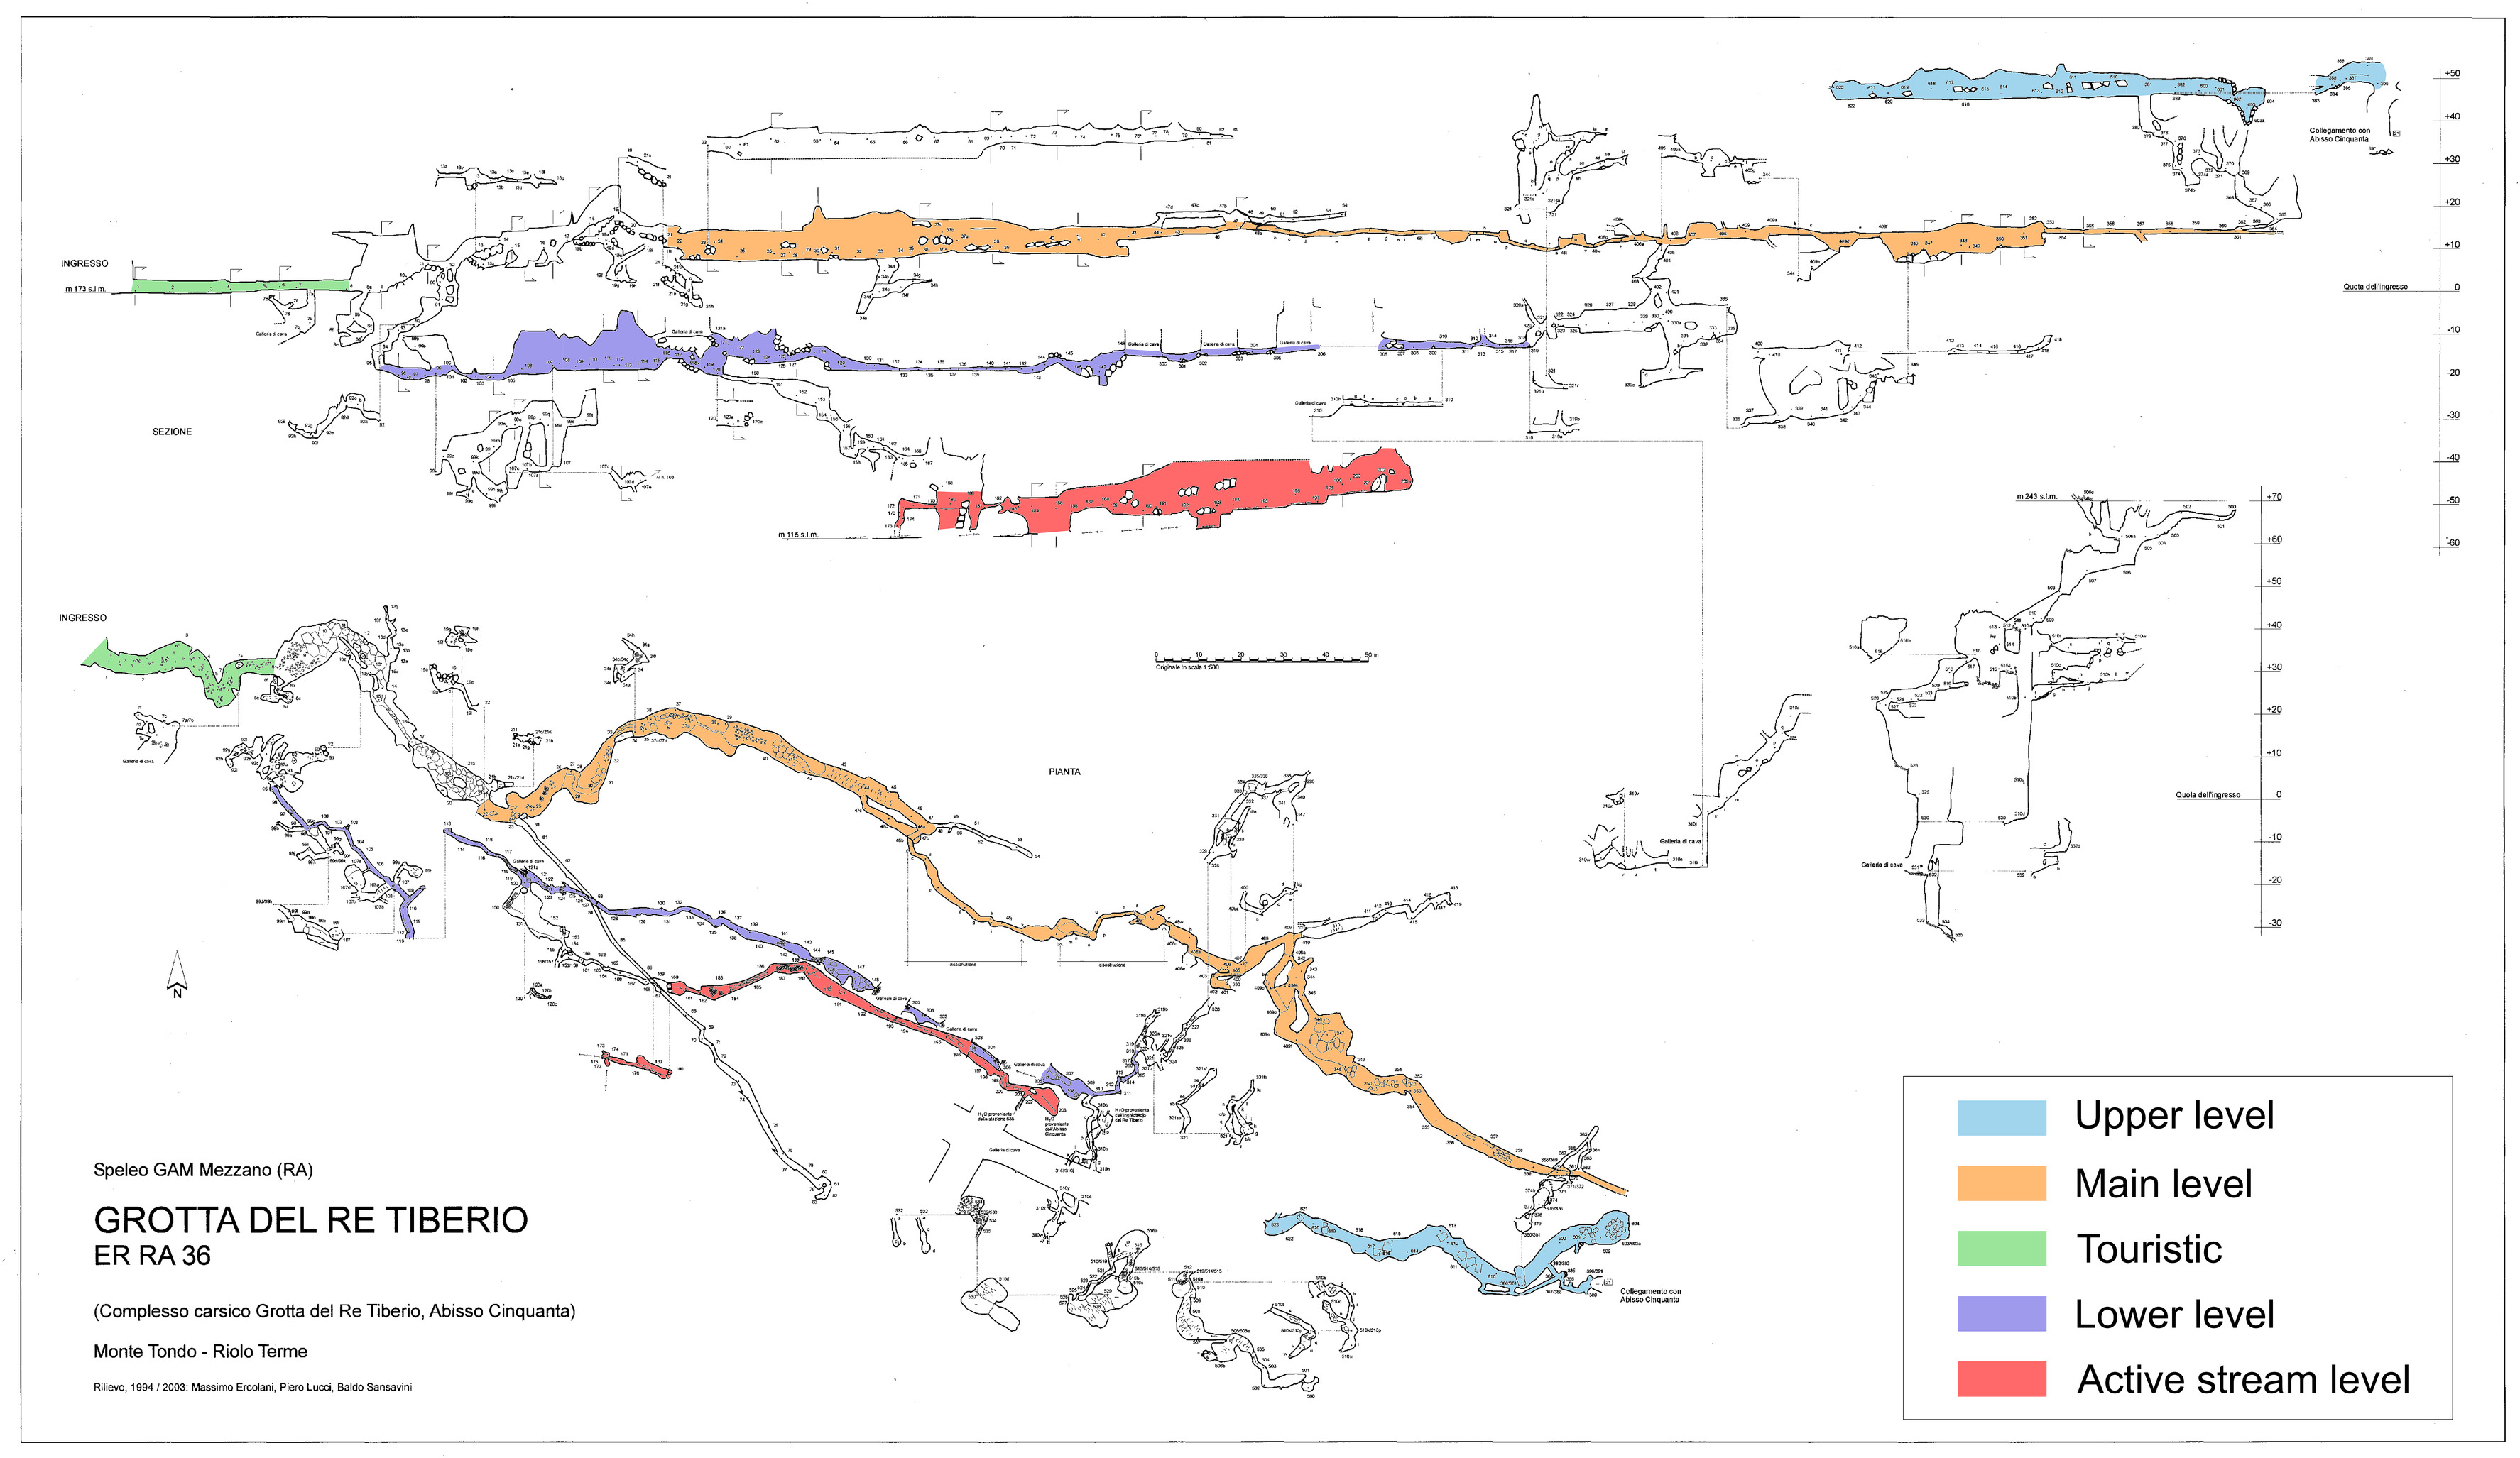
Cave surveying and geomorphological observations: The initial phase involved analyzing the topographic cave survey (Figure 2) conducted between 1994 and 2003 using traditional methods with a combined clinometer-compass and a 20-m measuring tape. The main cave levels were subsequently resurveyed using a Disto-X laser range finder to enhance accuracy. The resulting cave maps were digitized, and the data was used to calculate the average topographic gradient of the main cave levels. This survey data is publicly accessible through the regional cadastre of natural cavities of Emilia-Romagna (https://geo.regione.emilia-romagna.it/schede/speleo/index.jsp?id=42100).
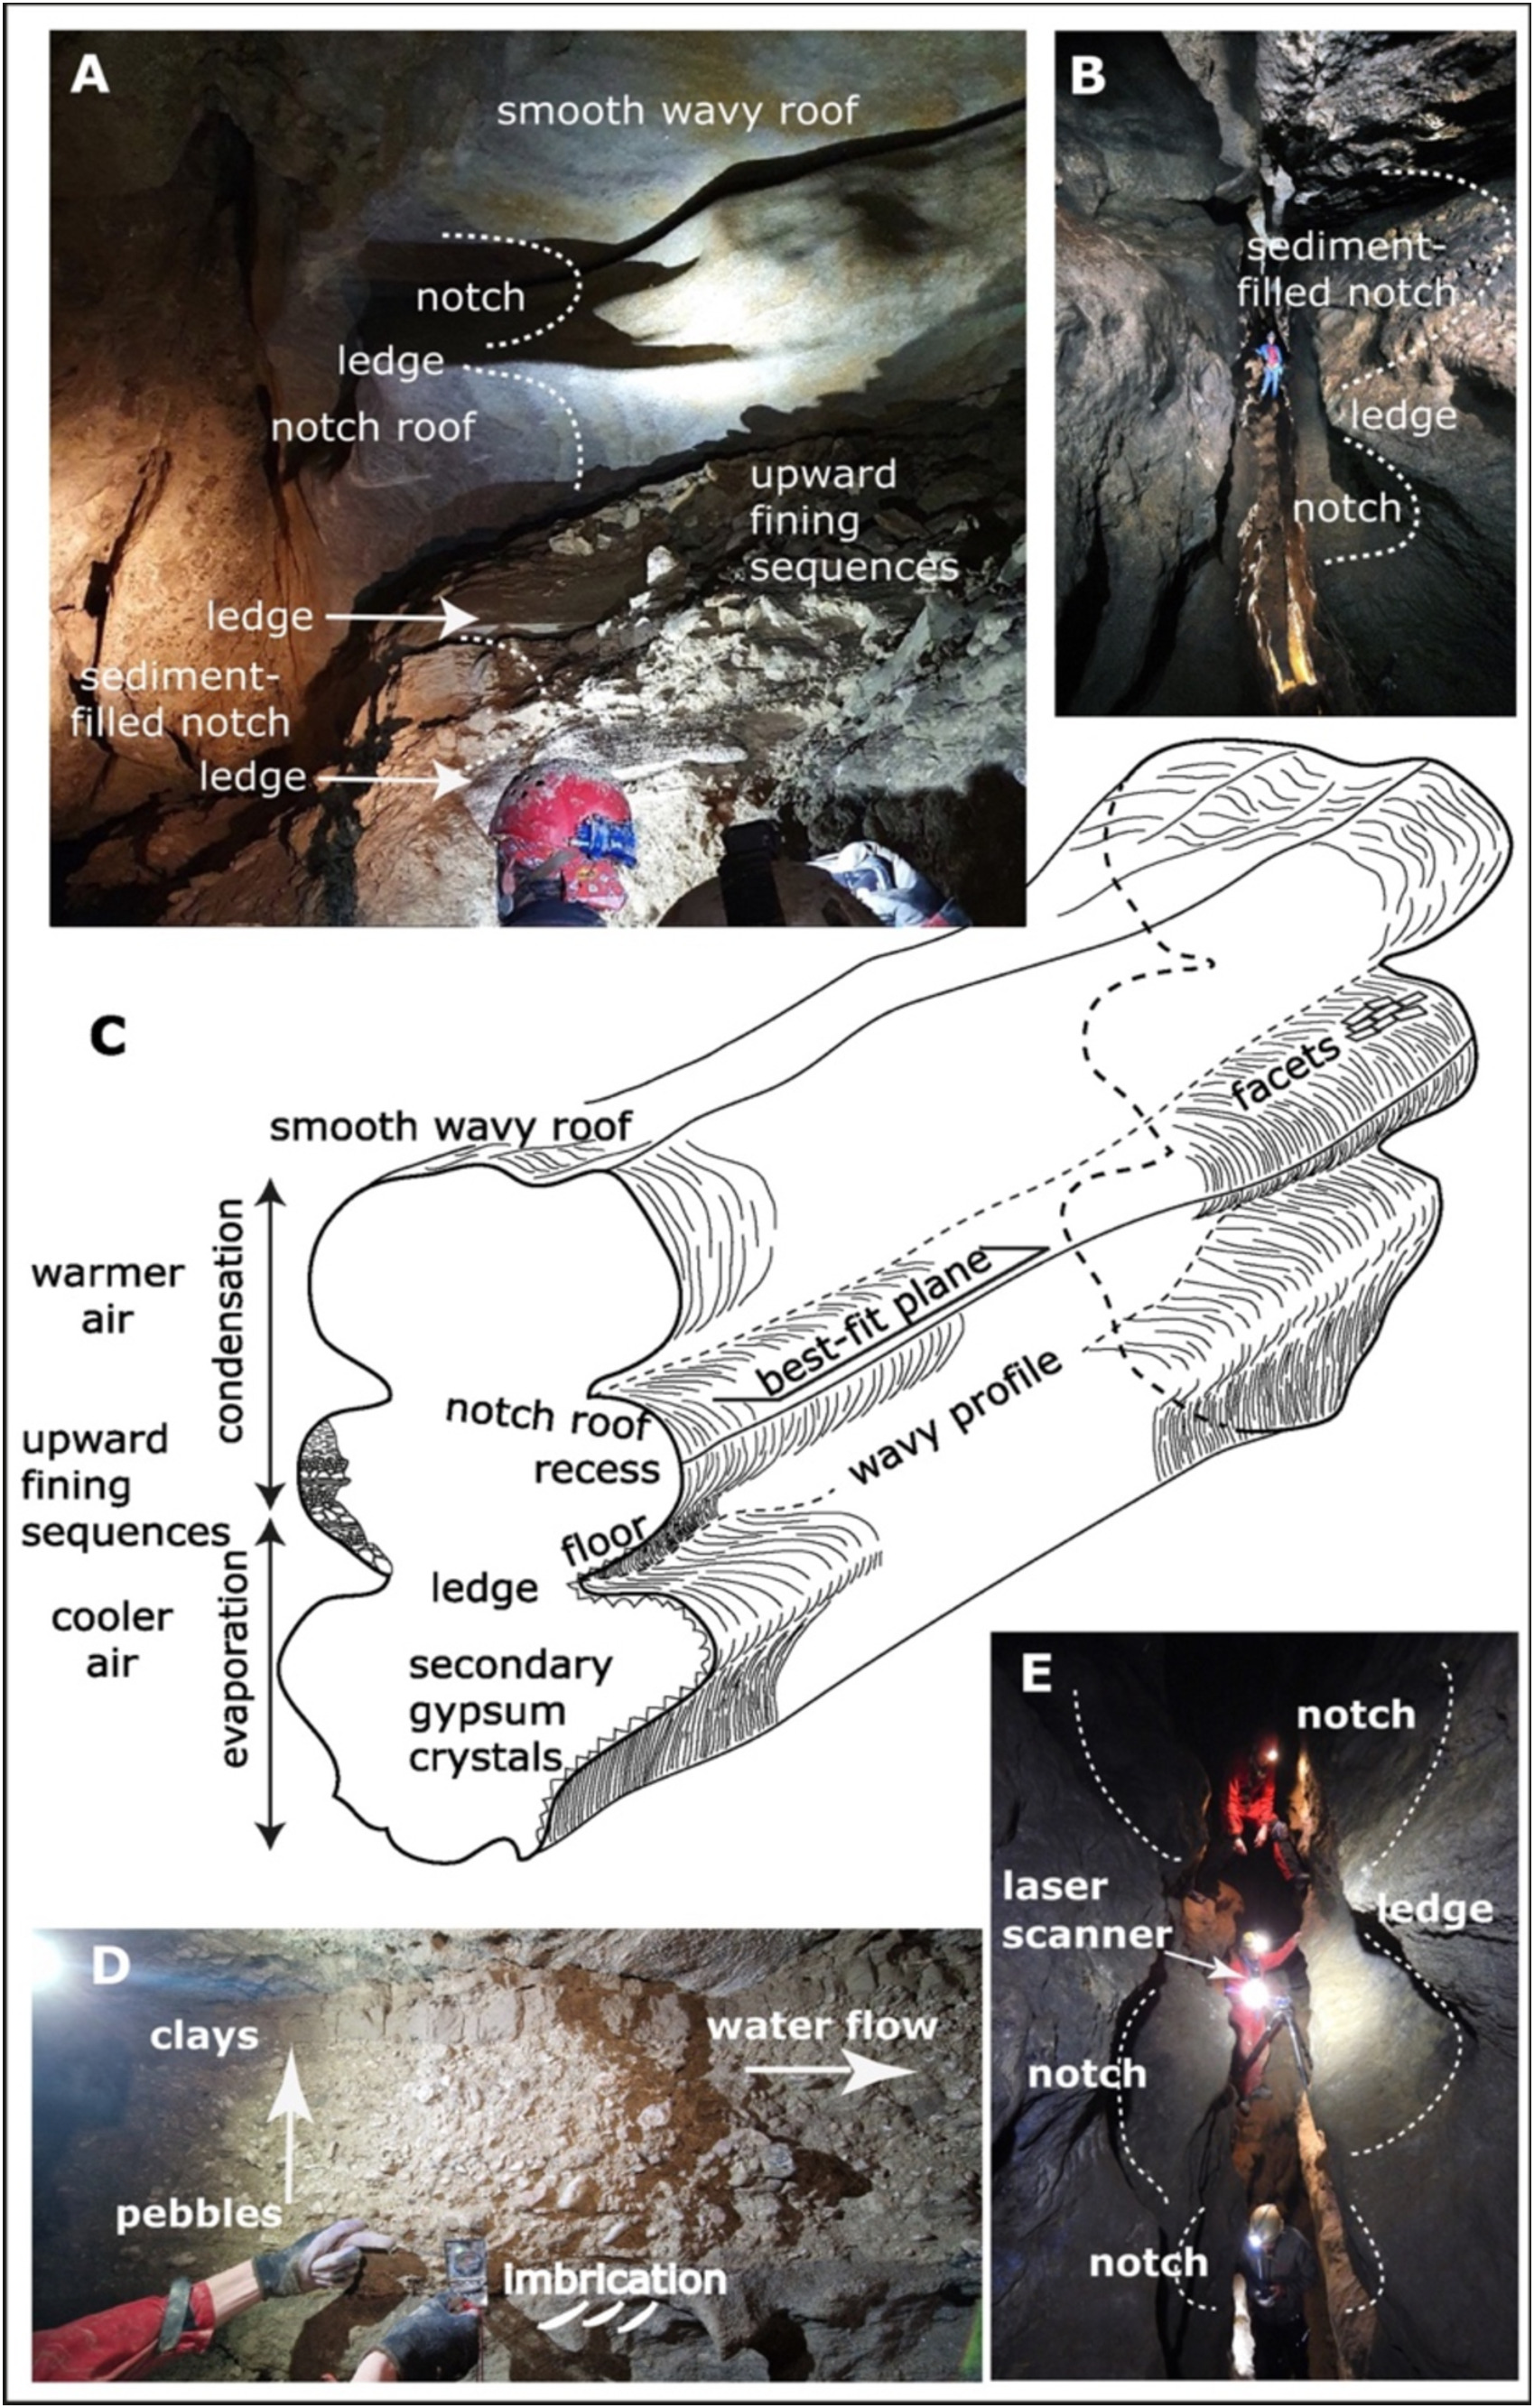
The geomorphological assessment mainly focused on the notches identified within the cave. Here, the term “notch” refers to sub-horizontal recesses in the cave walls, also known as vadose and antigravitative wall notches or solution ramps, typically exhibiting a slope with the same dip and dip direction as the cave stream that formed them. Our subsequent quantitative analysis using laser scanners focused on these structures, aiming to measure their slope direction. Additionally, we mapped fluvial deposits and measured the imbrication of clasts where present.
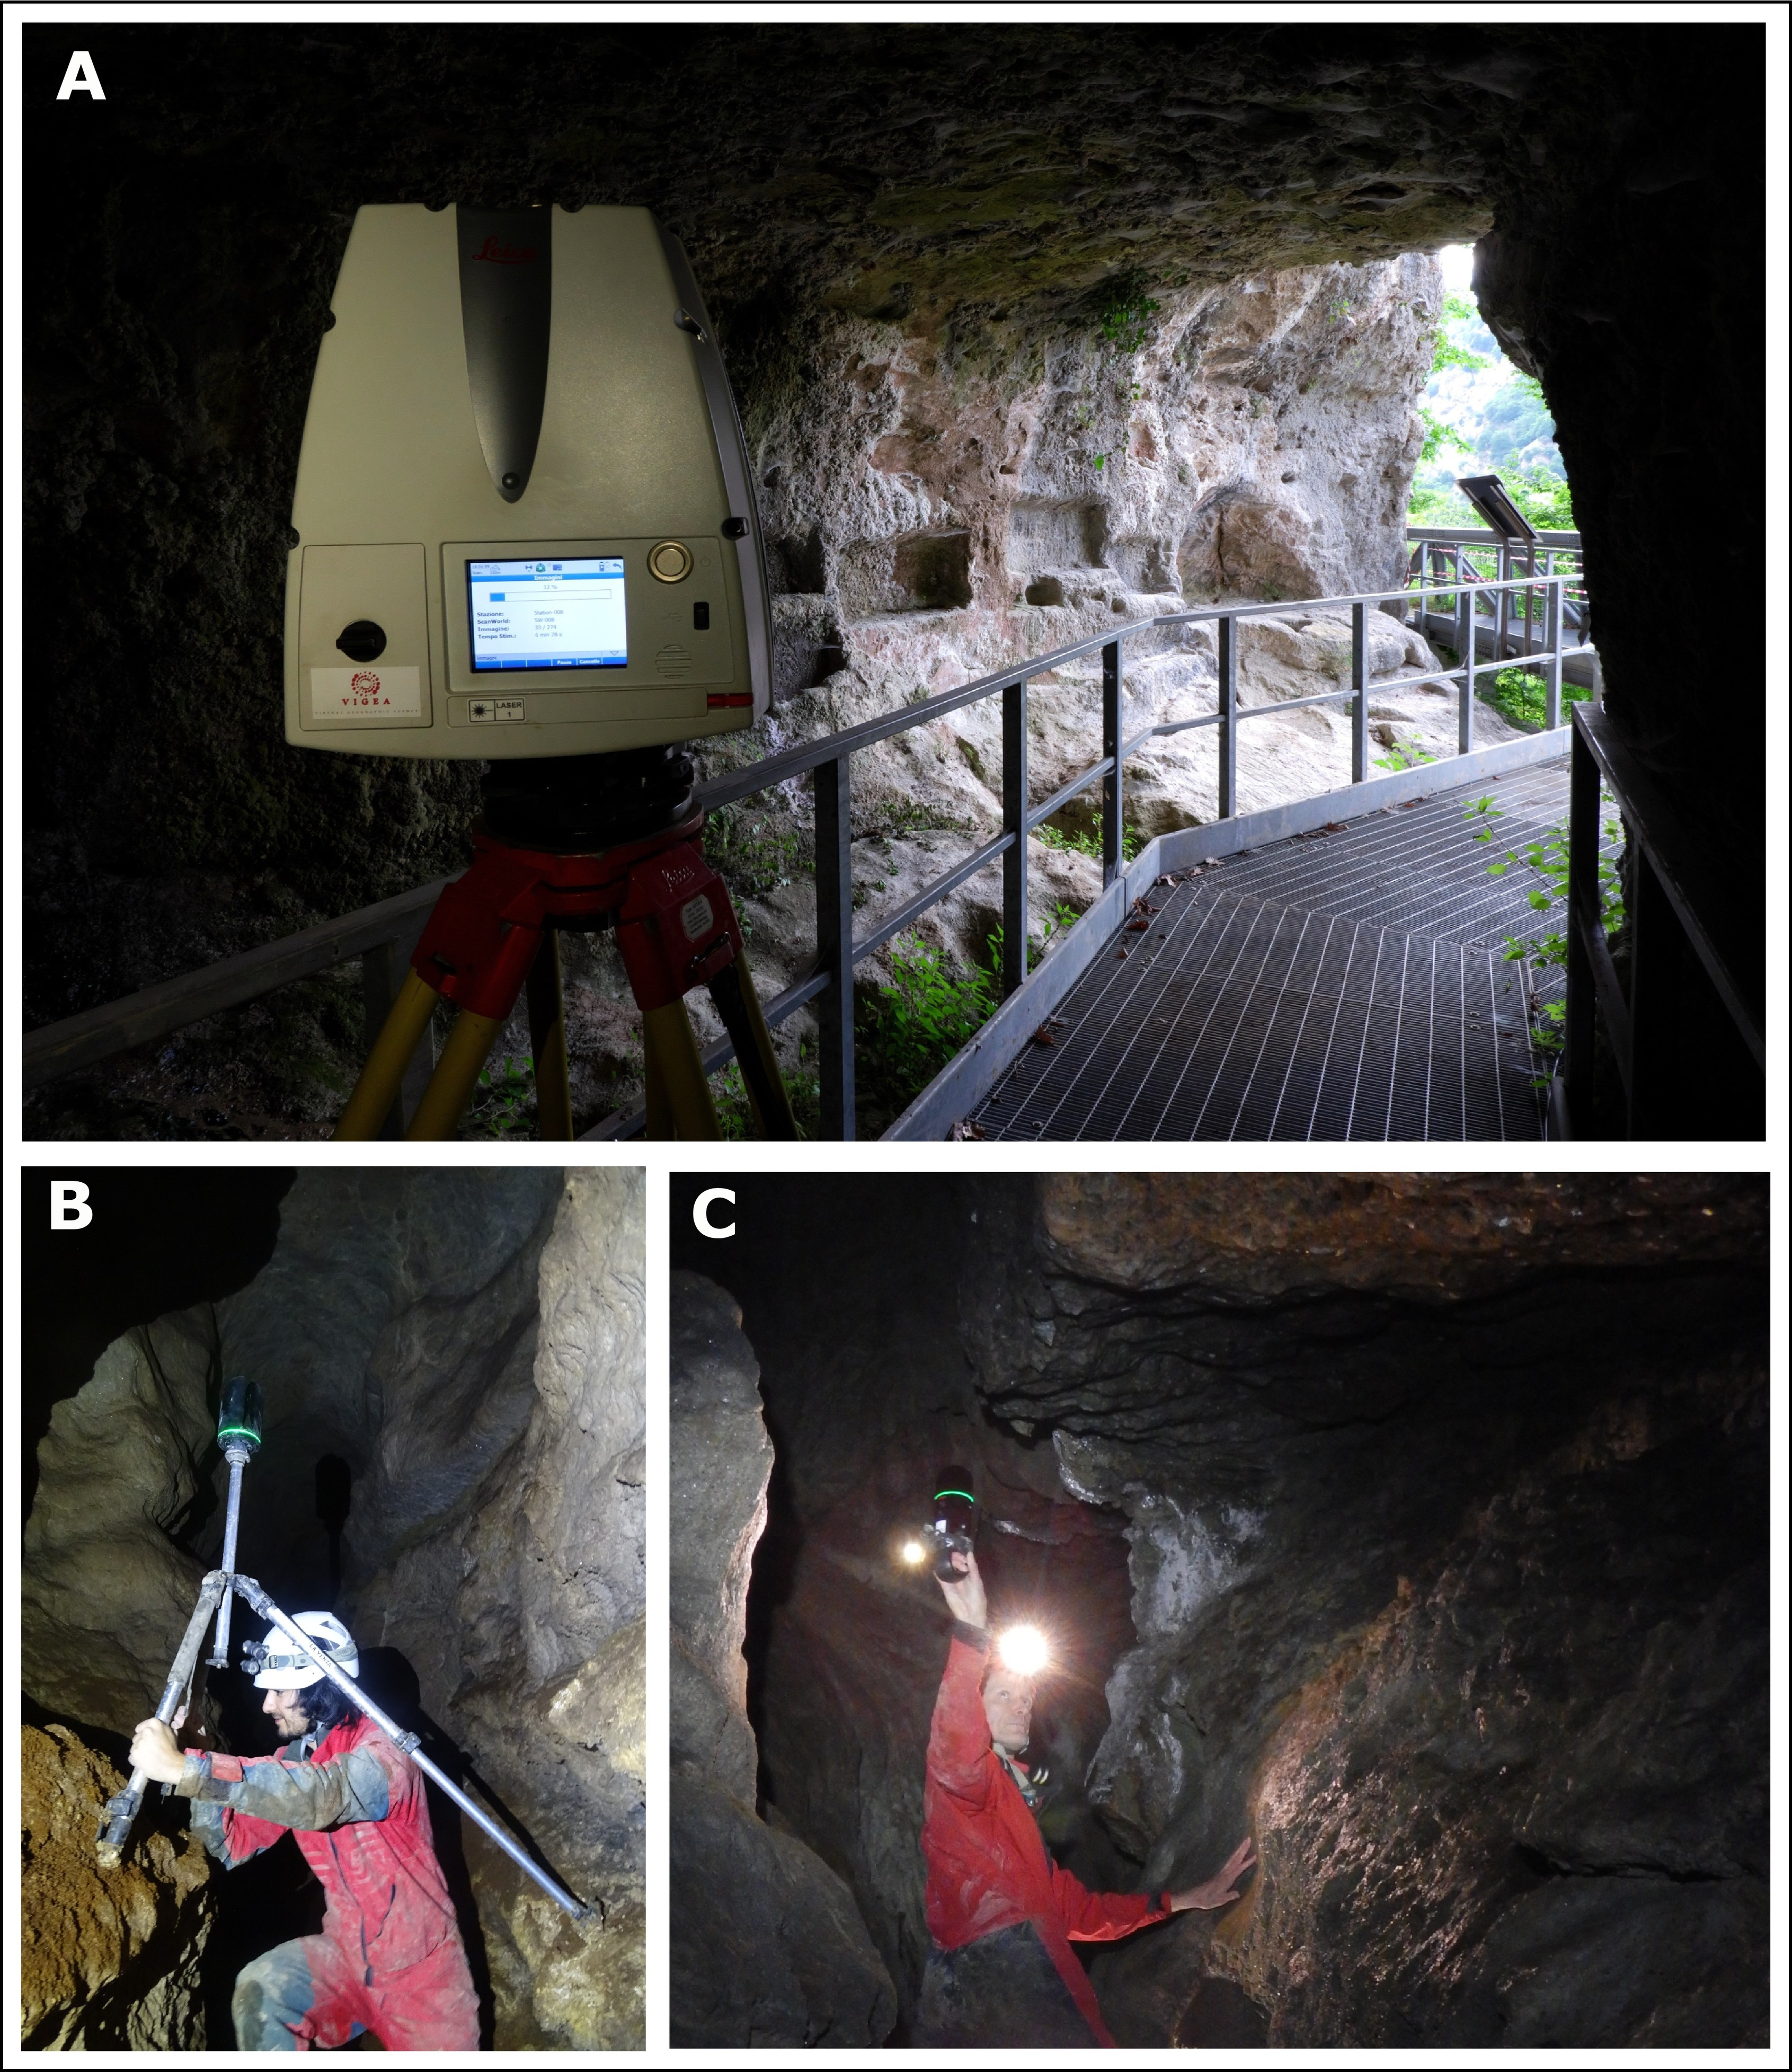
Laser scan acquisition: We employed three different laser scanners to create a comprehensive 3D point cloud of the main Re Tiberio cave level. These included (1) a Leica P40 ScanStation for larger areas, (2) a Leica BLK360 for narrower sections, and (3) a highly mobile BLK2GO hand-held scanner to capture data in cave segments inaccessible to the larger and more precise scanners (Figure 3).
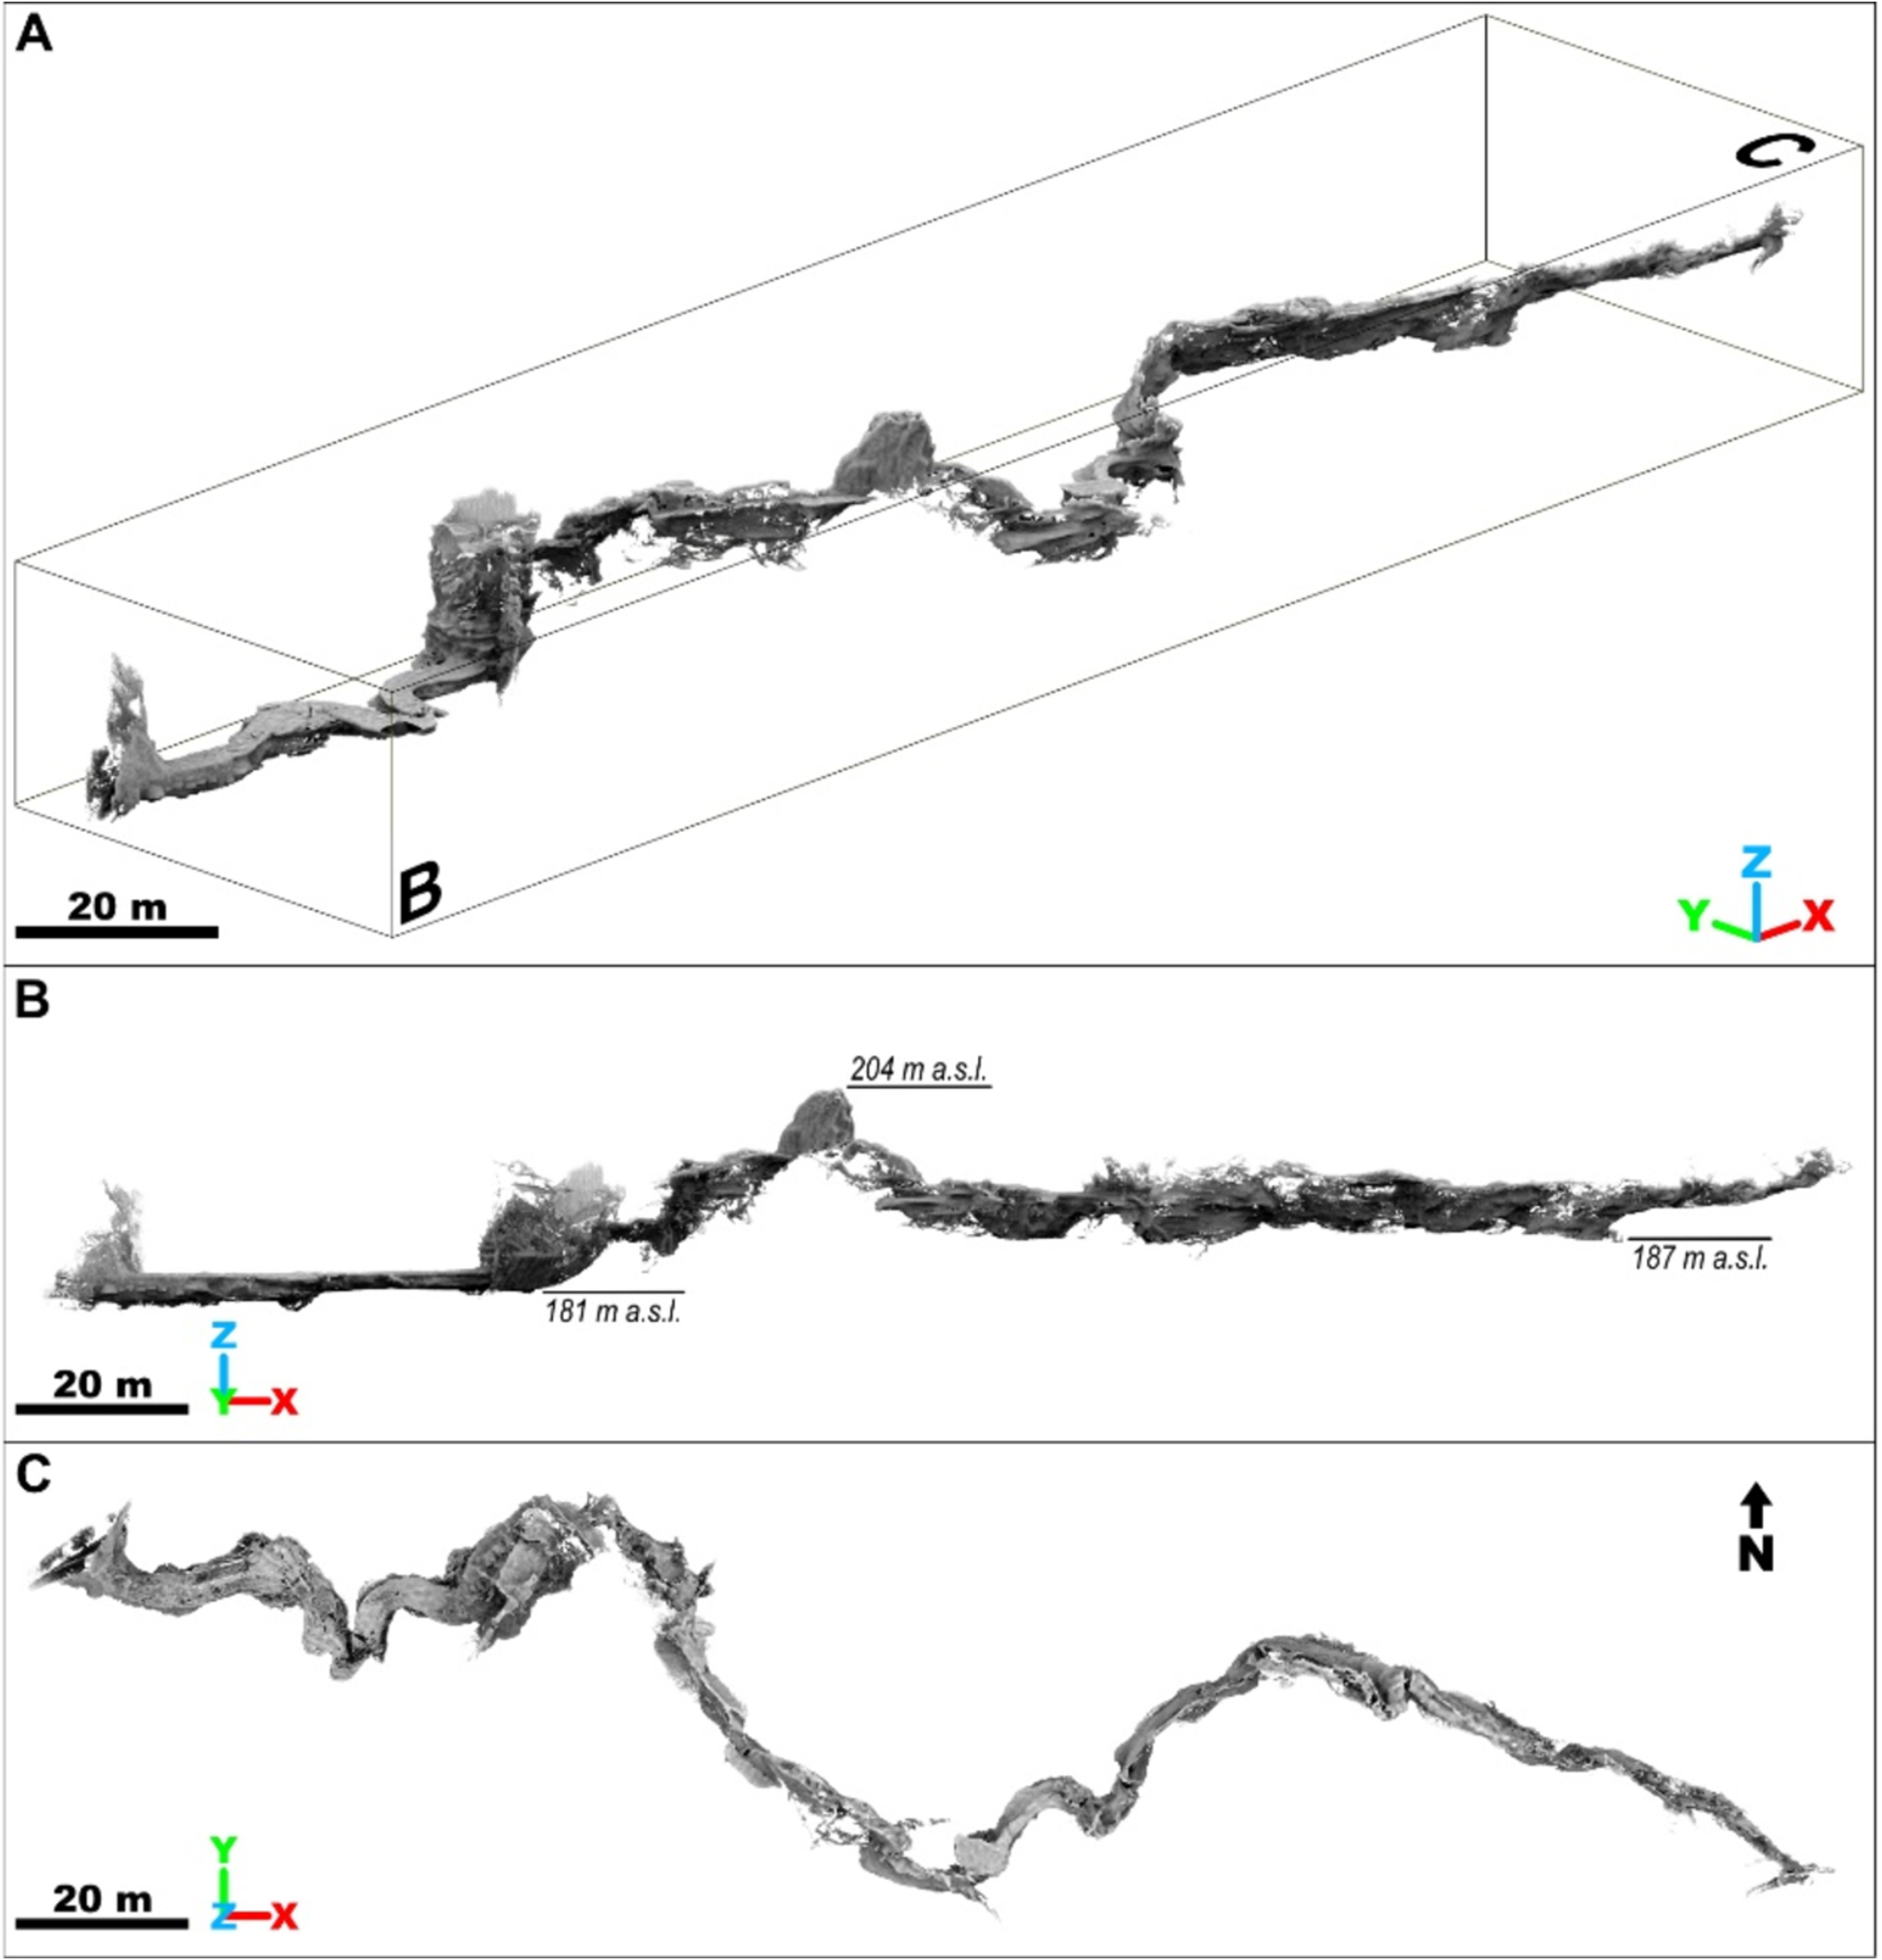
All raw data from the three scanners were registered using the LeicaCyclone and the CloudCompare softwares to generate a unified, high-resolution 3D point cloud of the cave (Figure 4). This point cloud was then georeferenced using data from the traditional cave survey, enabling representative measurements within the model as if we were inside the cave.
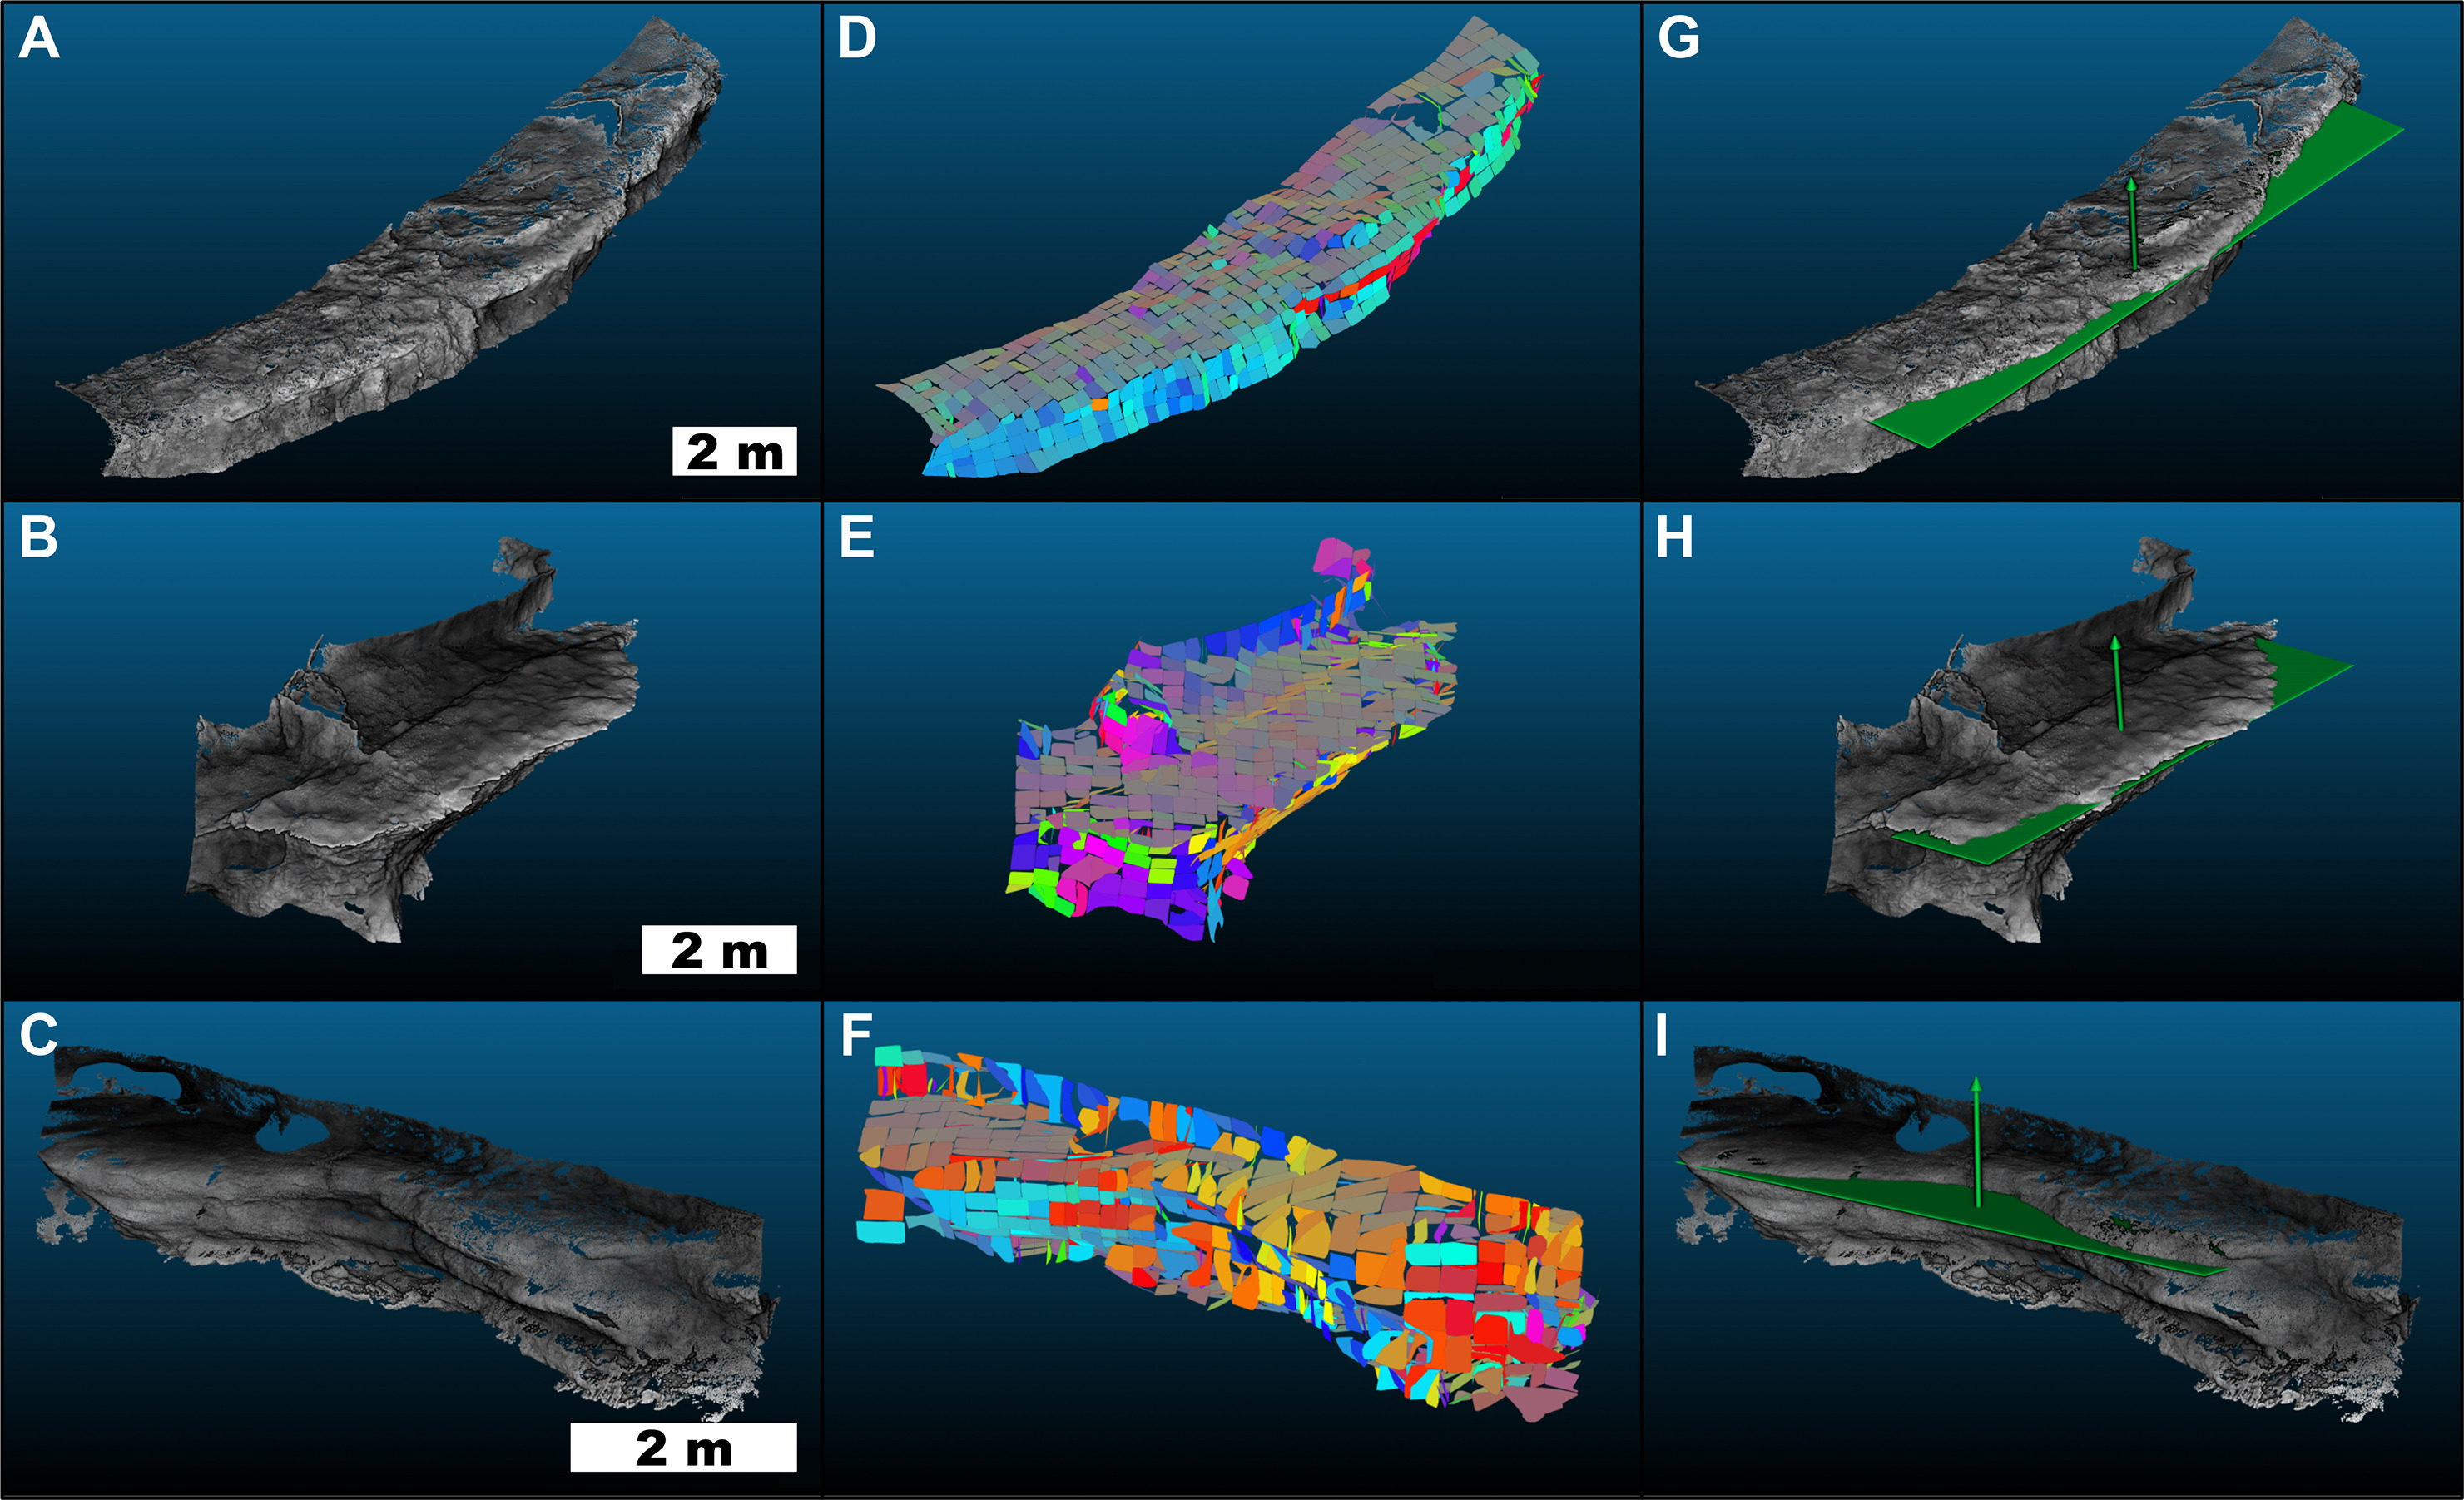
The main step in our paleoflow analysis was the identification of the notches. This was performed manually using CloudCompare and the ShadeVis and Eye-Dome Lighting visualization enhancement tools. Subsequently, to measure the spatial orientation of the notches within the point cloud, we utilized the CloudCompare qFacets plugin (Dewez et al., 2016). This tool allowed us to segment the point clouds into individual planar facets and measure their dip and dip direction (Figure 5). Furthermore, we measured the dip and dip direction of the best-fit planes fitted to the points of maximum curvature at the inner end of each notch (Figure 6), applying the ‘trace tool’ of the CloudCompare qCompass plugin (Thiele et al., 2017).
We also calculated the slope direction of different notch clusters identified in the 3D point cloud. Our working hypothesis posited that during the simultaneous downcutting of the Senio valley and the development of the Re Tiberio Cave system, notches belonging to the same generation would have formed at similar altitudes, distinct from those of other generations, and their overall slope would indicate the direction of the formative water flow.
These are the main results of our research:
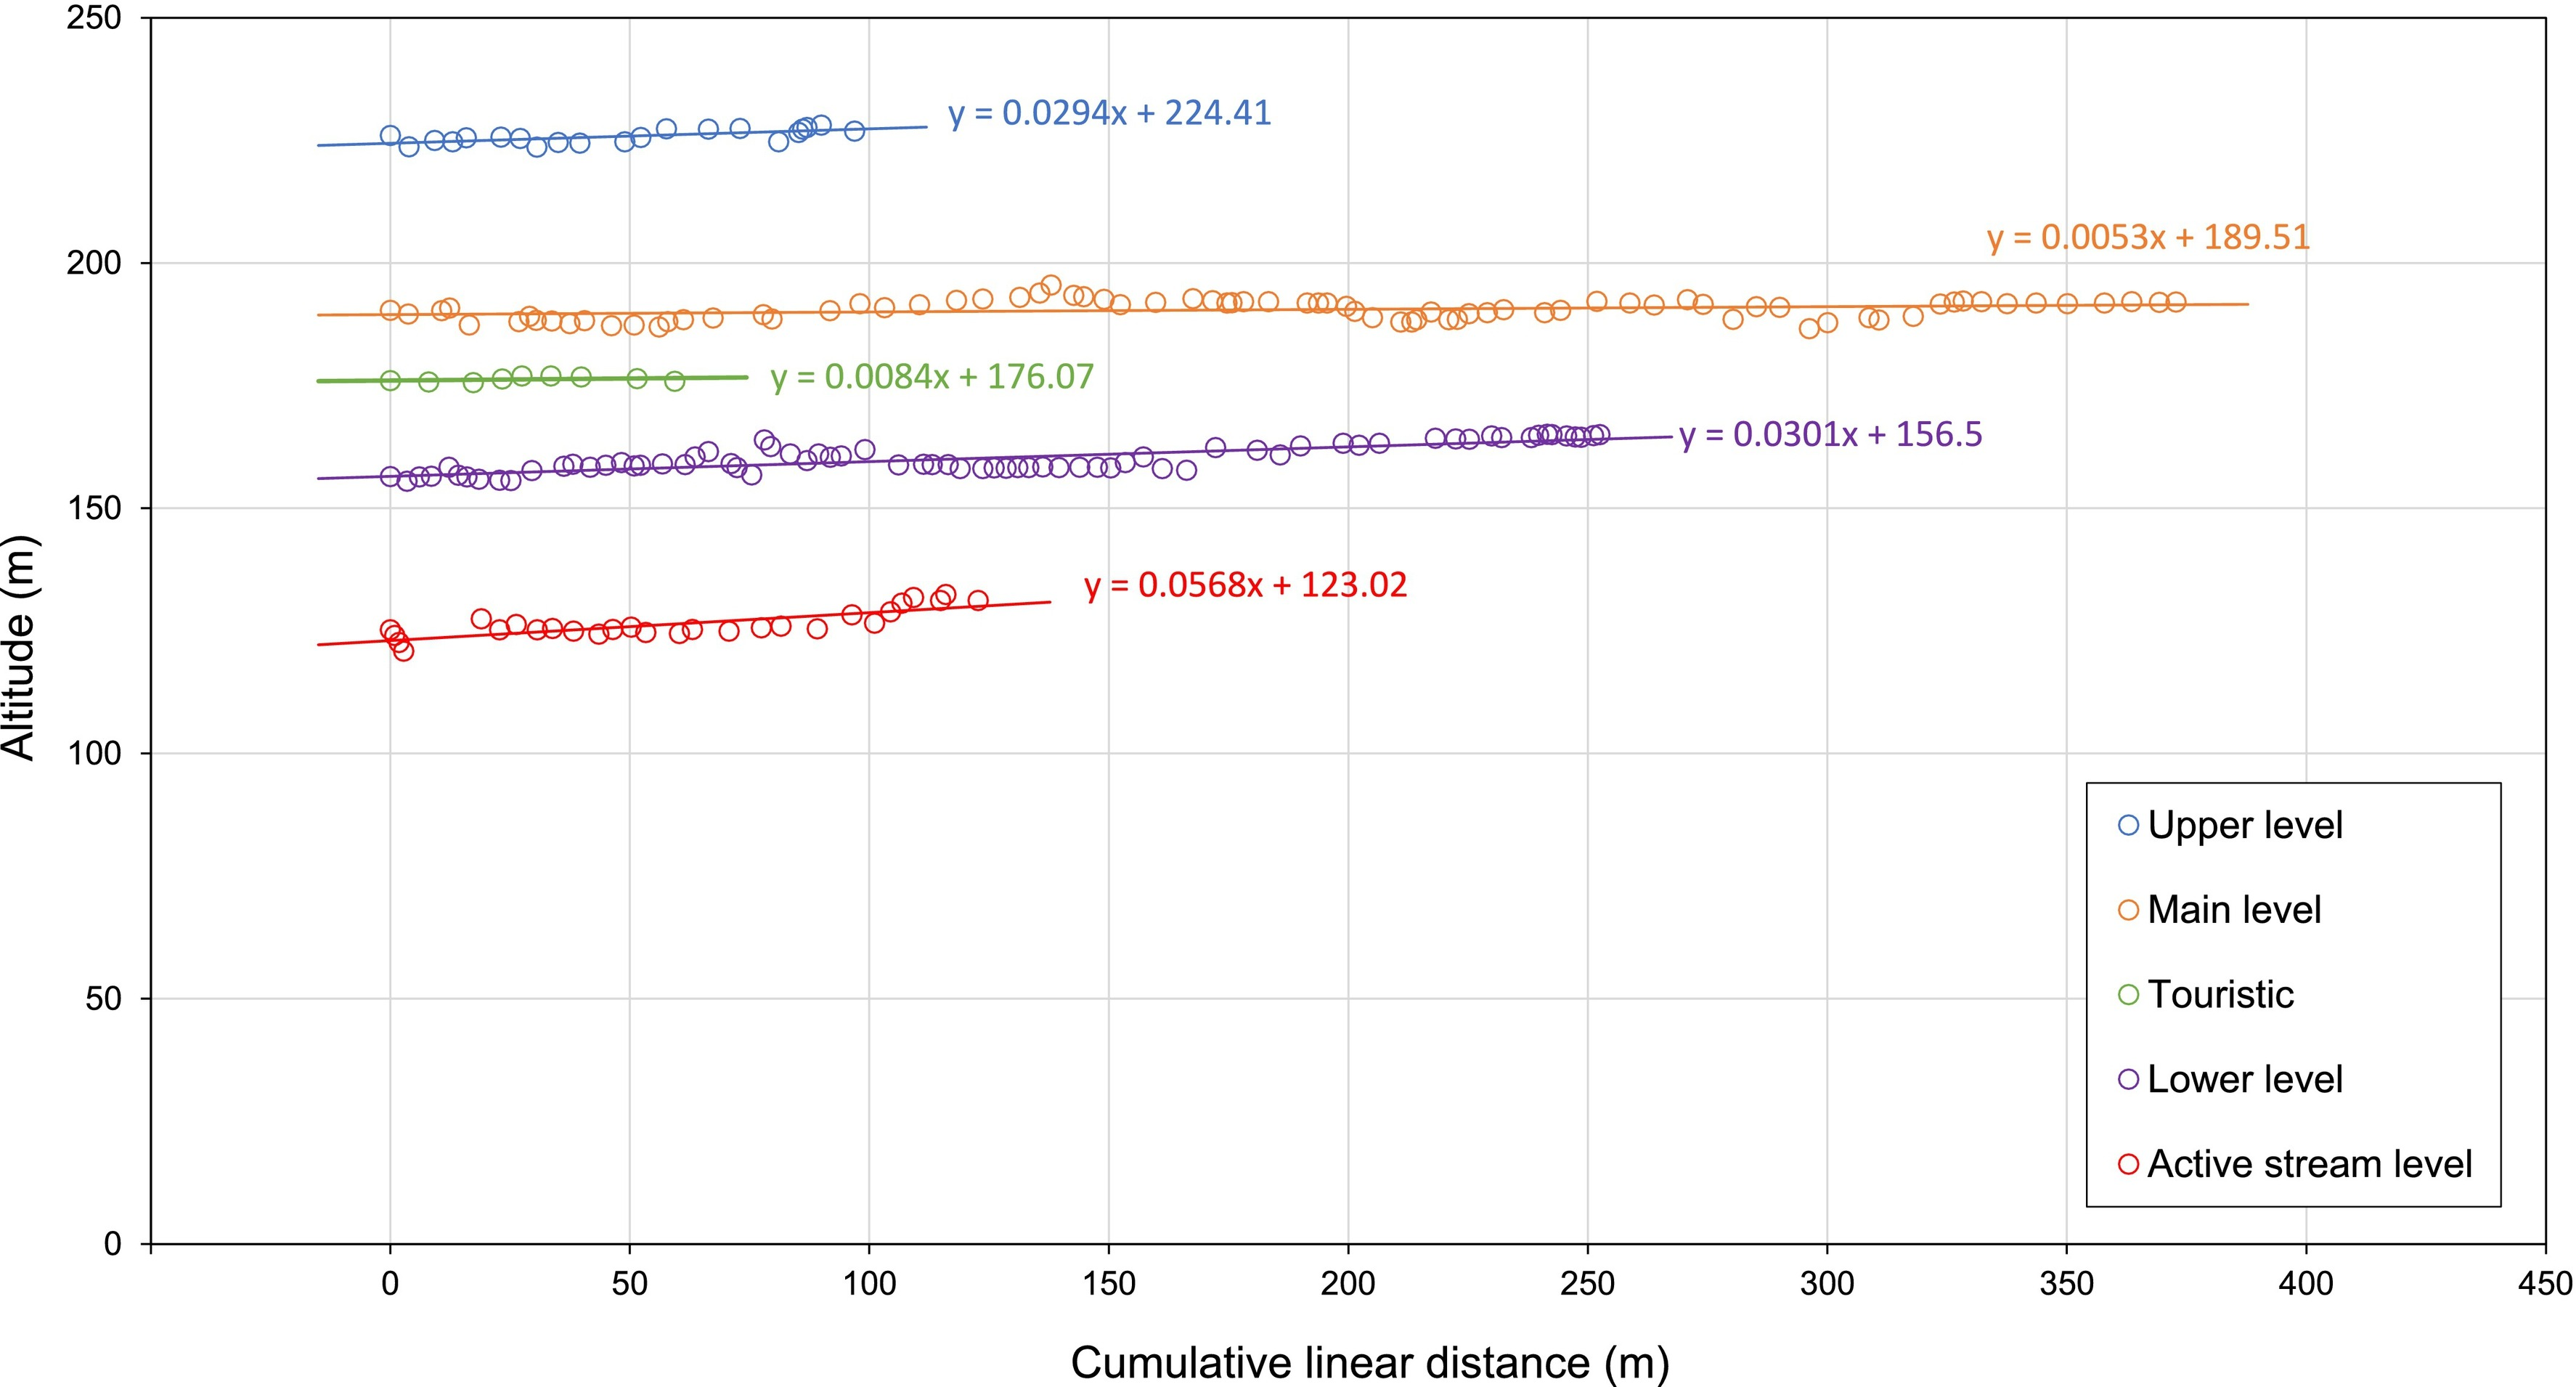
- Despite significant disturbances from rockfalls and sediment fills, the five main sub-horizontal galleries identified in the topographic survey of the Re Tiberio Cave exhibit an average gradient (0.5 to 6%) towards the north-west, corresponding to the location of the present-day cave entrance (Figure 7).
The pebbly portions of the sparsely preserved fluvial deposits show imbrication indicating a flow direction towards the current cave entrance (Figure 6D).
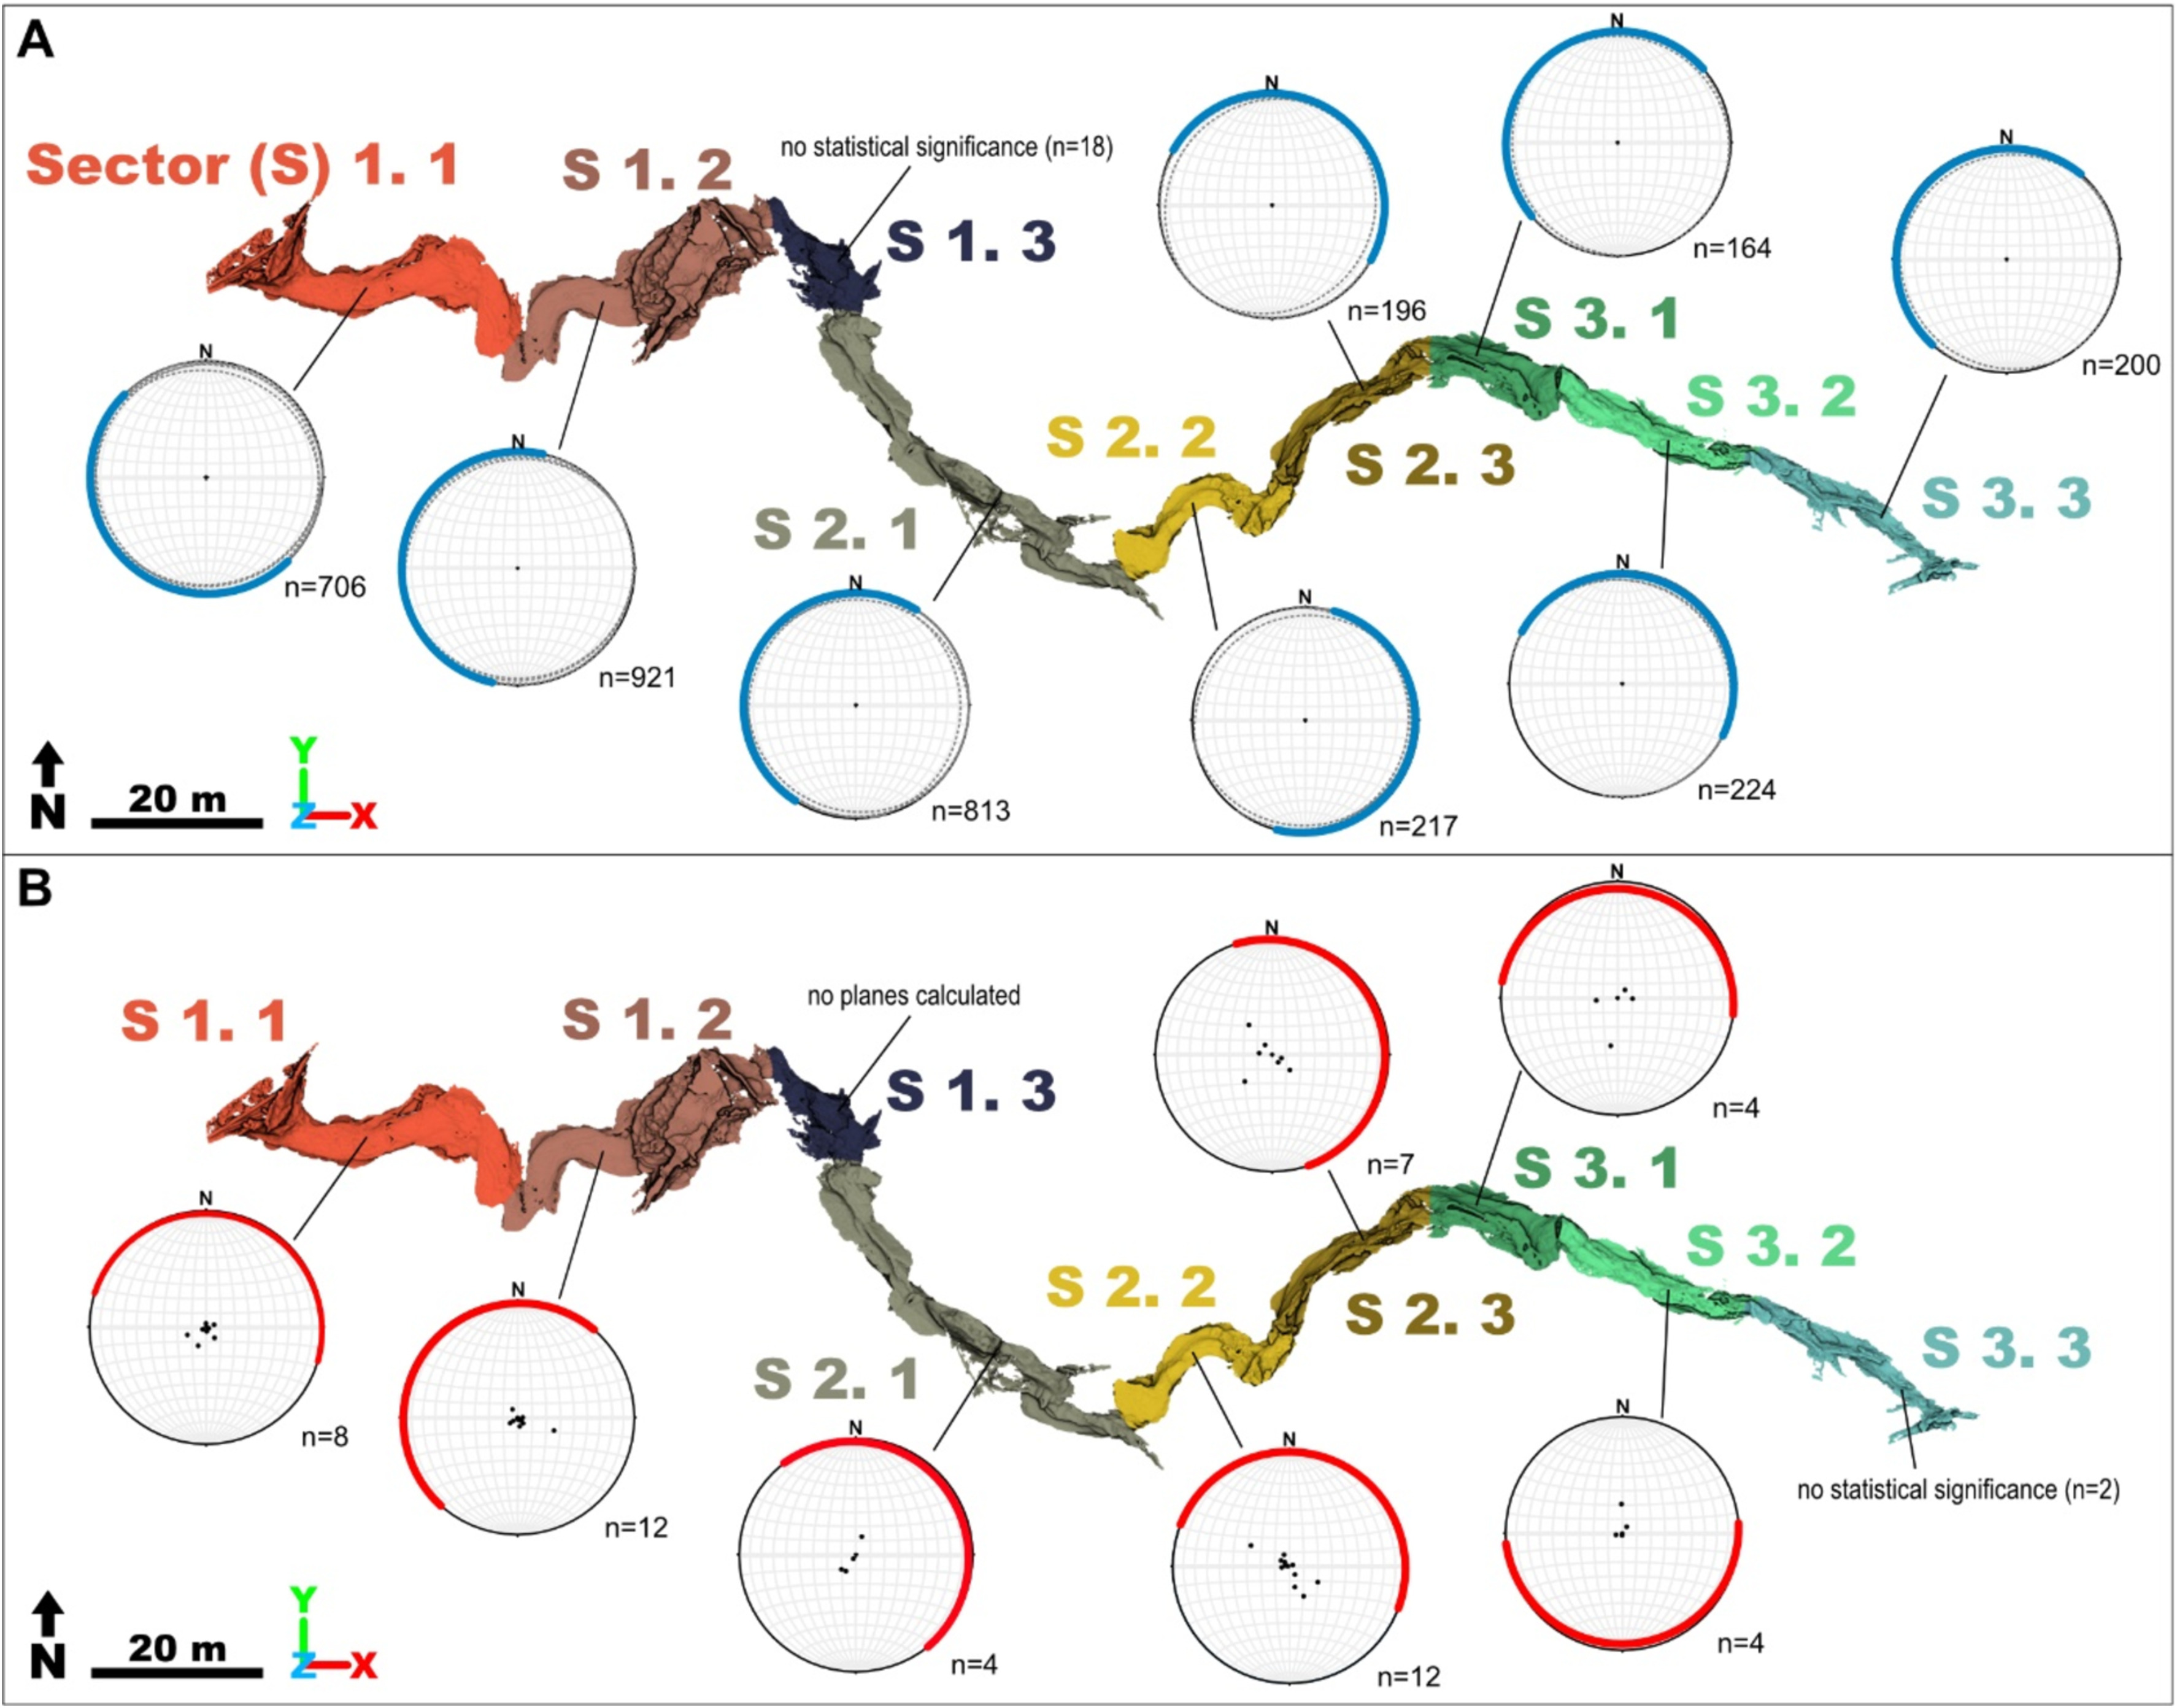
The mean orientation of the sub-horizontal facets modeled in the notches within 5 out of 8 sectors of the 3D point cloud displays dip directions towards the current cave entrance (Figure 8A).
The mean dip direction of the best-fit planes did not yield conclusive results (Figure 8B).
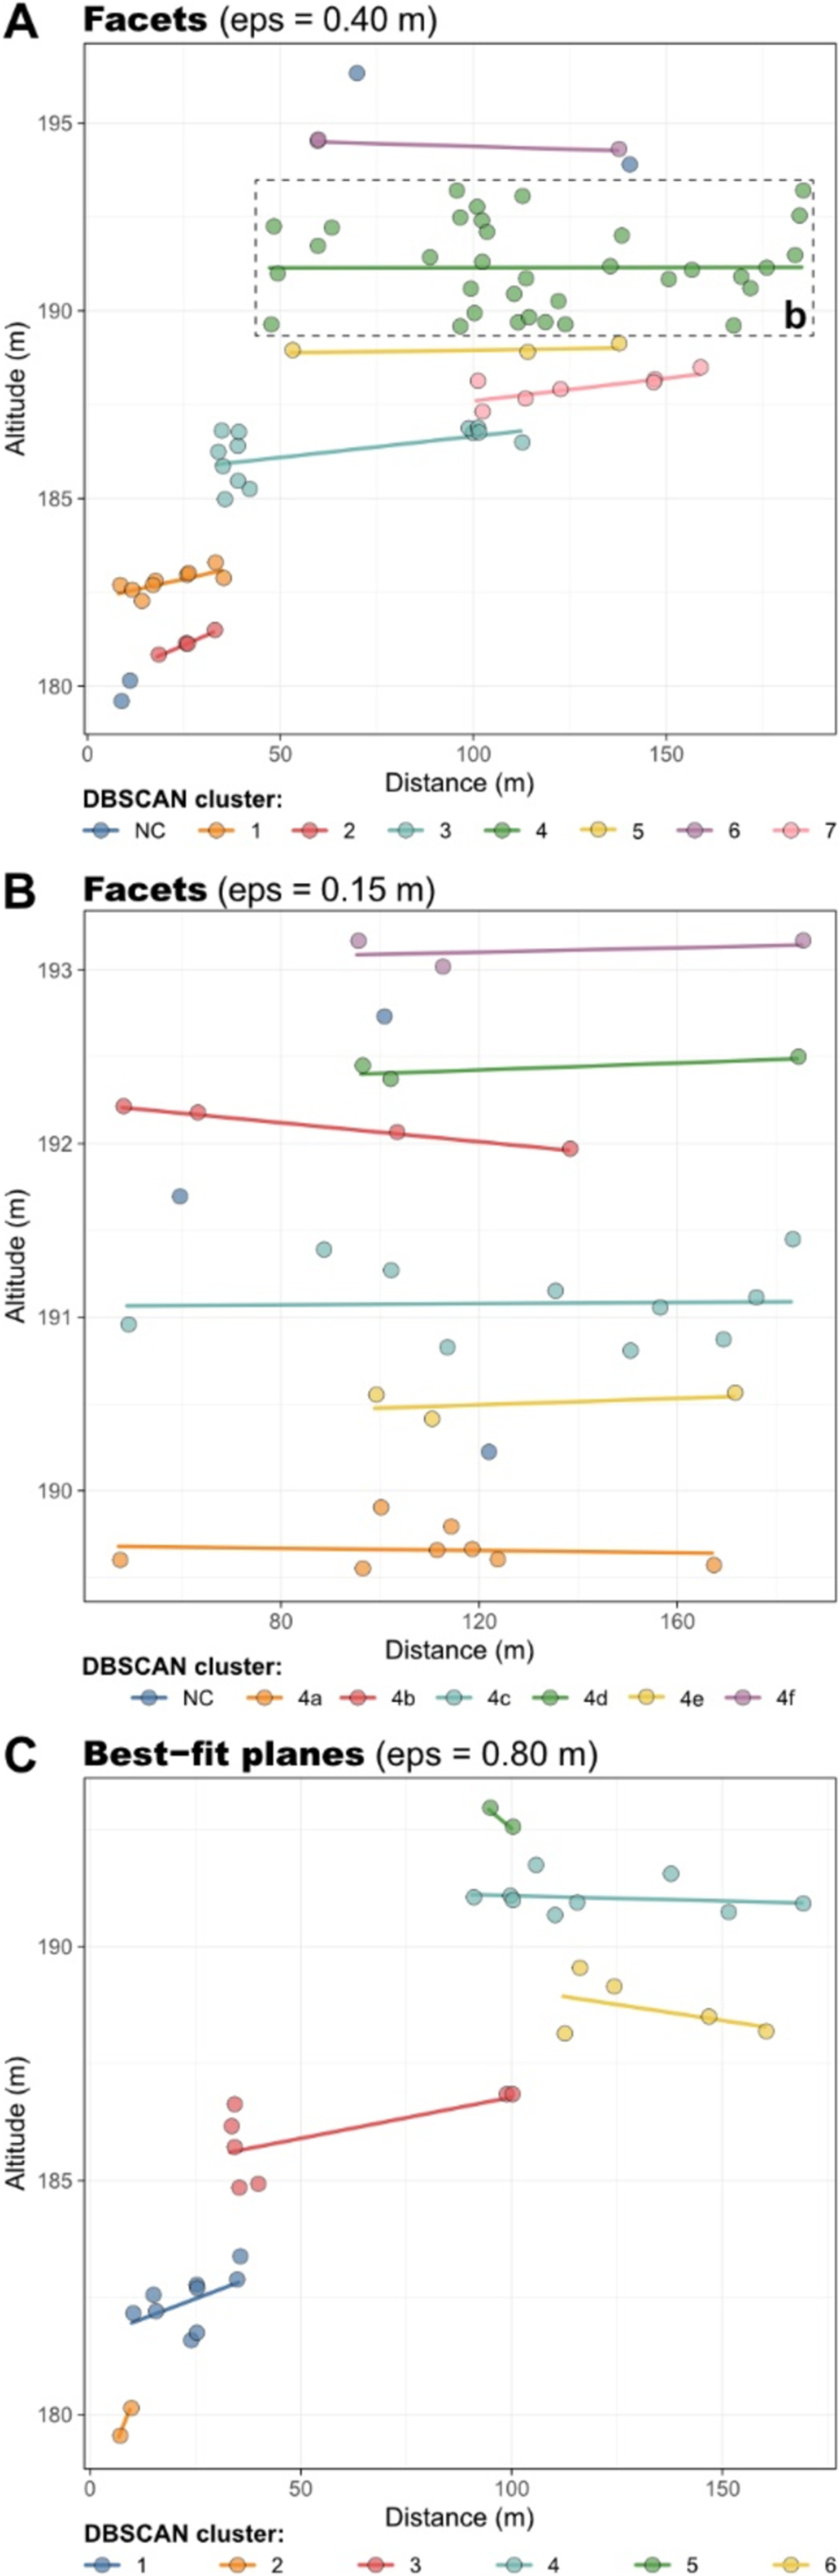
- The spatial analysis of the slope direction among notches belonging to the same elevation-based cluster revealed that 5 out of 7 clusters exhibit a slope direction towards the cave entrance. Conversely, the same analysis based on the elevation of the best-fit planes produced inconclusive results (Figure 9).
Conclusions:
The results derived from individual analyses, including traditional mapping, geomorphological analysis, and even Terrestrial Laser Scanning (TLS) morphometrics, proved inconclusive by themselves. However, the integration of all datasets provided robust support for a north-westward flow. This allowed us to confidently conclude that the main passage of the Re Tiberio Cave represented an ancient resurgence flowing from ESE to WNW.